








Modern association football is often described as an unpredictable, low-scoring invasion sport where a single deflection or refereeing decision can dictate the final outcome. Yet beneath this surface chaotic noise lies a predictable mathematical architecture governed by discrete probability distributions. Among quantitative analysts, the Bivariate Poisson Distribution remains one of the foundational frameworks for forecasting match scorelines, evaluating team strengths, and stripping away emotional bias from performance evaluation.
1. The Univariate Poisson Assumption and Its Flaws
In elementary sports modeling, goals scored by a home team ($X$) and an away team ($Y$) are frequently treated as two independent random variables following a standard Poisson distribution:
P(Y = y) = (e^(-μ) * μ^y) / y!
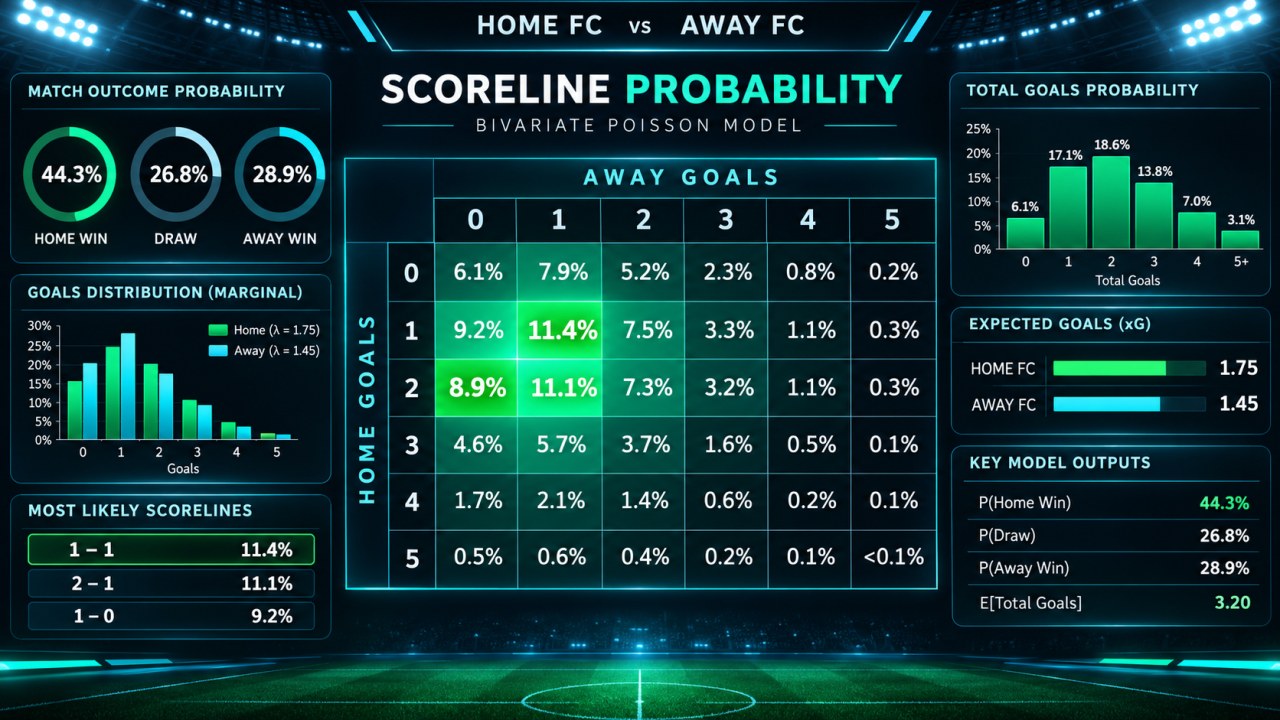
Where λ represents the home team’s expected goal expectancy and μ represents the away team’s expected goal expectancy. By multiplying P(X = x) * P(Y = y), an analyst can construct a scoreline grid ranging from 0-0 to 5-5 and aggregate the probability cells into 1X2 market distributions (Home Win, Draw, Away Win).
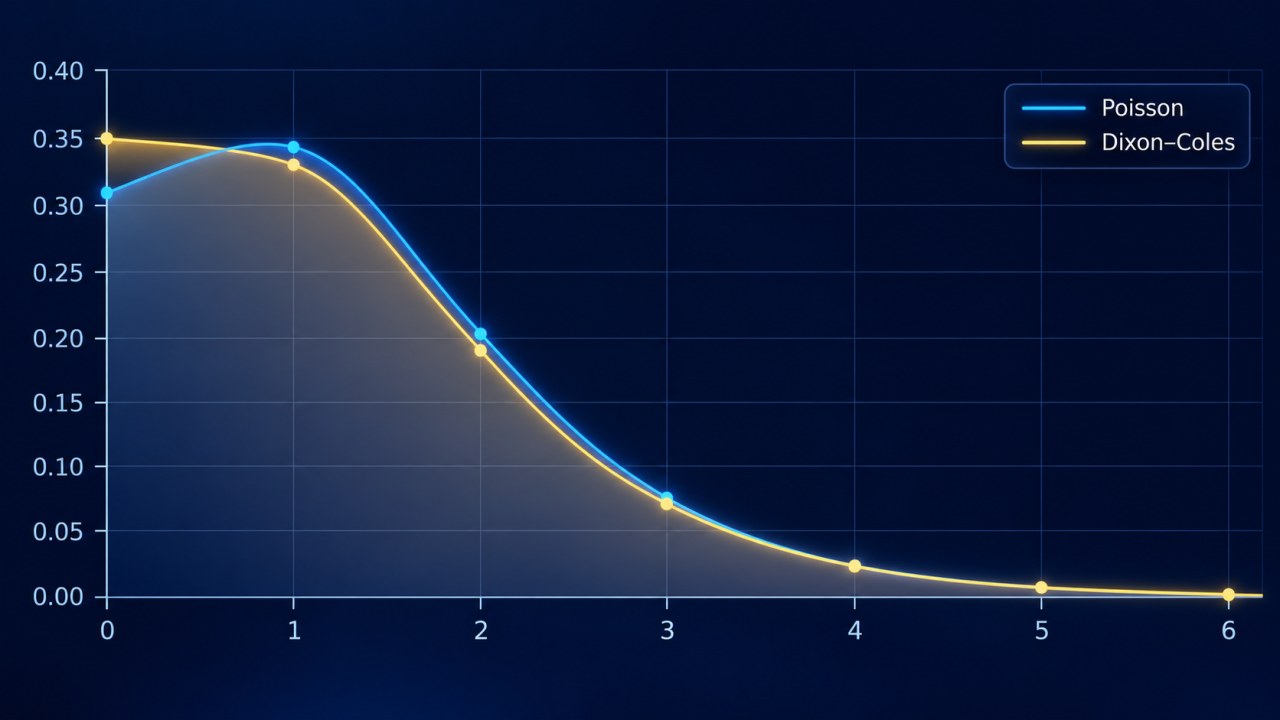
However, genuine football matches violate the assumption of independence. Goals are not scored in a vacuum. A team that concedes an early goal changes its tactical risk profile: they press higher, commit numbers forward, and leave space behind, simultaneously increasing their own probability of scoring and their vulnerability to counter-attacks. Furthermore, draws—particularly 0-0 and 1-1—occur in elite European leagues at rates significantly higher than an independent Poisson model predicts.
2. The Dixon-Coles Low-Score Adjustment
To correct for low-score correlation without abandoning the computational elegance of Poisson modeling, Mark Dixon and Stuart Coles introduced a vital bivariate adjustment factor $\tau(x, y)$ that modifies the probabilities of scorelines where goals are $\le 1$:
- For 0 - 0: $\tau(0, 0) = 1 - \lambda \mu \rho$ (deflating or inflating scoreless draws based on league parameter $\rho$).
- For 1 - 0: $\tau(1, 0) = 1 + \mu \rho$.
- For 0 - 1: $\tau(0, 1) = 1 + \lambda \rho$.
- For 1 - 1: $\tau(1, 1) = 1 - \rho$.
- For all scores $\ge 2$: $\tau(x, y) = 1$ (the standard independent Poisson applies).
In the SportyAI model, parameter $\rho$ is calibrated across 50,000+ historical fixtures in the database. Incorporating this low-score adjustment instantly restores real-world accuracy to 0-0 and 1-1 forecasts, aligning model projections with empirical market pricing.
3. Parameter Estimation: Attack, Defense, and Home Pitch Influence
How do we establish the values of $\lambda$ and $\mu$ for an upcoming fixture like Arsenal vs. Chelsea or Real Madrid vs. Atletico? The calculation requires decomposing team form into three distinct components:
- Attack Strength ($\alpha_i$): The ratio of goals generated by Team $i$ relative to the league average across a rolling 20-match window, with recent fixtures receiving exponential time decay weighting.
- Defense Weakness ($\beta_j$): The ratio of goals conceded by Team $j$ relative to the league average. A team with a $\beta$ of 0.80 concedes 20% fewer goals than an average side.
- Home Pitch Factor ($\gamma$): The persistent territorial and crowd advantage observed in top-flight leagues (averaging approximately +0.32 expected goals in Europe).
The expected goals are then formulated as:
μ_away = α_away * β_home * League_Avg_Away_Goals
4. From Mathematical Output to Tactical Decision-Making
Once the bivariate probability matrix is populated, it outputs not only the single most likely scoreline (e.g., 2-1 at 11.4%), but also the comprehensive cumulative distribution across all secondary markets. This includes:
- Over / Under 2.5 Goals: Calculated by summing all scoreline probabilities where $(x + y) > 2.5$.
- Both Teams to Score (BTTS): Calculated by taking $1 - [P(X=0) + P(Y=0) - P(0,0)]$.
- High-Probability Safety Margins (Under 4.5 Goals): Summing the 15 most frequent score combinations, typically capturing 85% to 92% of the cumulative probability space.
By replacing subjective impressions with cold mathematical distributions, sports intelligence analysts gain a systematic lens through which to evaluate football. At SportyAI, this mathematical framework powers every automated match simulation, establishing a rigorous benchmark for performance analysis across global football leagues.
Explore our daily Poisson probability distributions, Expected Goals (xG) models, and comprehensive tactical fixture previews.