








For over a century, matchday summaries relied on a remarkably blunt metric to communicate attacking dominance: the total shot count. A 35-yard speculative strike that sailed into the upper tier was counted equally alongside a 4-yard tap-in into an open net. In the modern era of quantitative sports intelligence, Expected Goals (xG) has permanently exposed the fallacy of raw shot volumes, providing an objective framework for evaluating finishing quality, chance creation, and defensive solidity.
1. The Core Philosophy of Expected Goals
At its essence, Expected Goals measures the probability that any given shot will result in a goal based on historical data from hundreds of thousands of comparable attempts. A penalty kick carries an xG value of exactly 0.79, reflecting the empirical fact that approximately 79% of penalties are successfully converted at the elite level. A shot awarded an xG of 0.05 implies that a striker taking that exact shot would score five times out of every 100 attempts.
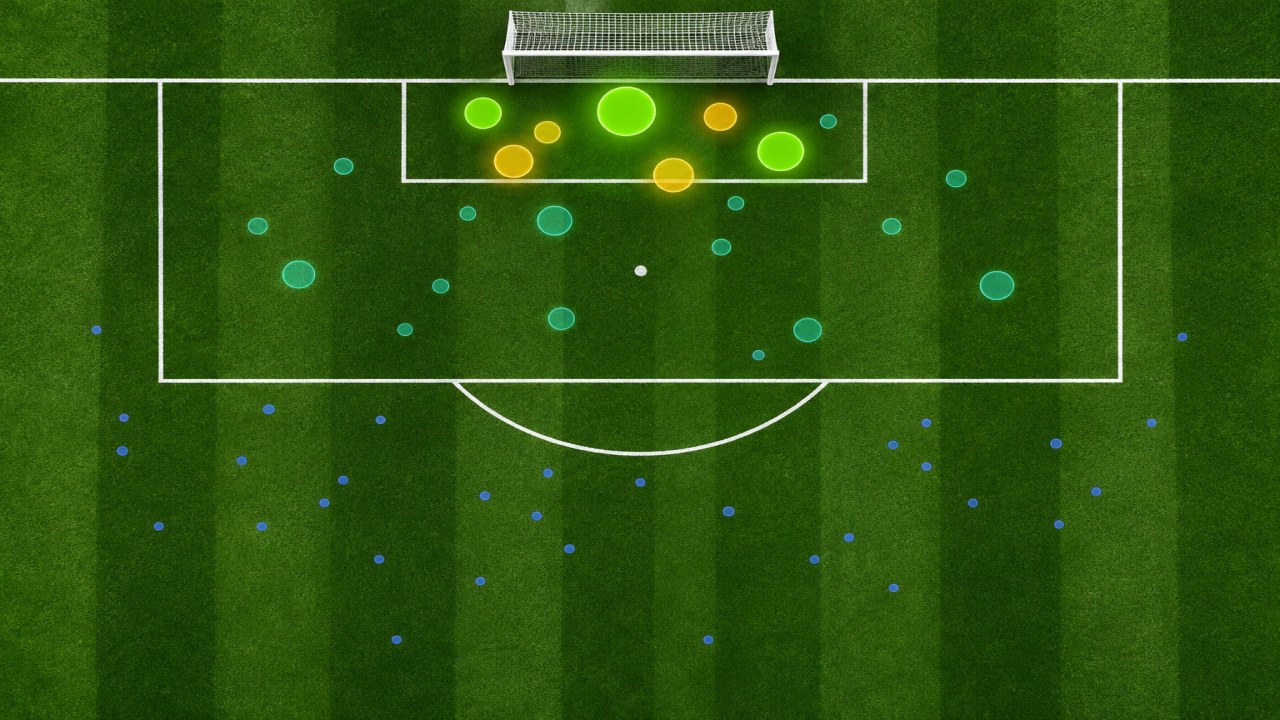
Modern xG models evaluate dozens of spatial and contextual variables at the precise micro-second the ball is struck:
- Distance to Goal: Every yard further from the goal line produces an exponential decline in conversion probability.
- Shot Angle: Wide angles dramatically narrow the visible target face between the goalkeeper and the posts.
- Body Part & Technique: Headers carry significantly lower expected conversion rates (~0.08 xG on average) than shots struck with the preferred foot (~0.14 xG) due to biomechanical control.
- Assist Modality: Cutbacks from the byline generate substantially higher xG than high looping crosses, as defenders and goalkeepers are forced to shift their weight across the box.
- Defensive Pressure & Goalkeeper Position: Advanced camera tracking models assess the density of defenders positioned between the ball and the net.
2. Non-Penalty Expected Goals (npxG): The Real Tactical Signal
While overall xG provides a top-line impression, tactical analysts prioritize Non-Penalty Expected Goals (npxG) when diagnosing a team’s true underlying performance. Because penalties are awarded via discrete refereeing decisions that carry massive variance (0.79 xG in a single action), an otherwise toothless attack can inflate its xG statistics through fortuitous handball calls.
Similarly, npxG per shot reveals a manager’s tactical philosophy. Under Pep Guardiola at Manchester City and Mikel Arteta at Arsenal, teams systematically discourage low-probability shots from outside the 18-yard box. Their tactical structures are engineered around creating high-percentage chances in the "Golden Zone" between the penalty spot and the 6-yard box, consistently producing an npxG per shot exceeding 0.15. Conversely, teams that frequently shoot from distance often register 20+ shots in a match while generating less than 1.1 total xG.
3. Finishing Variance and Regression to the Mean
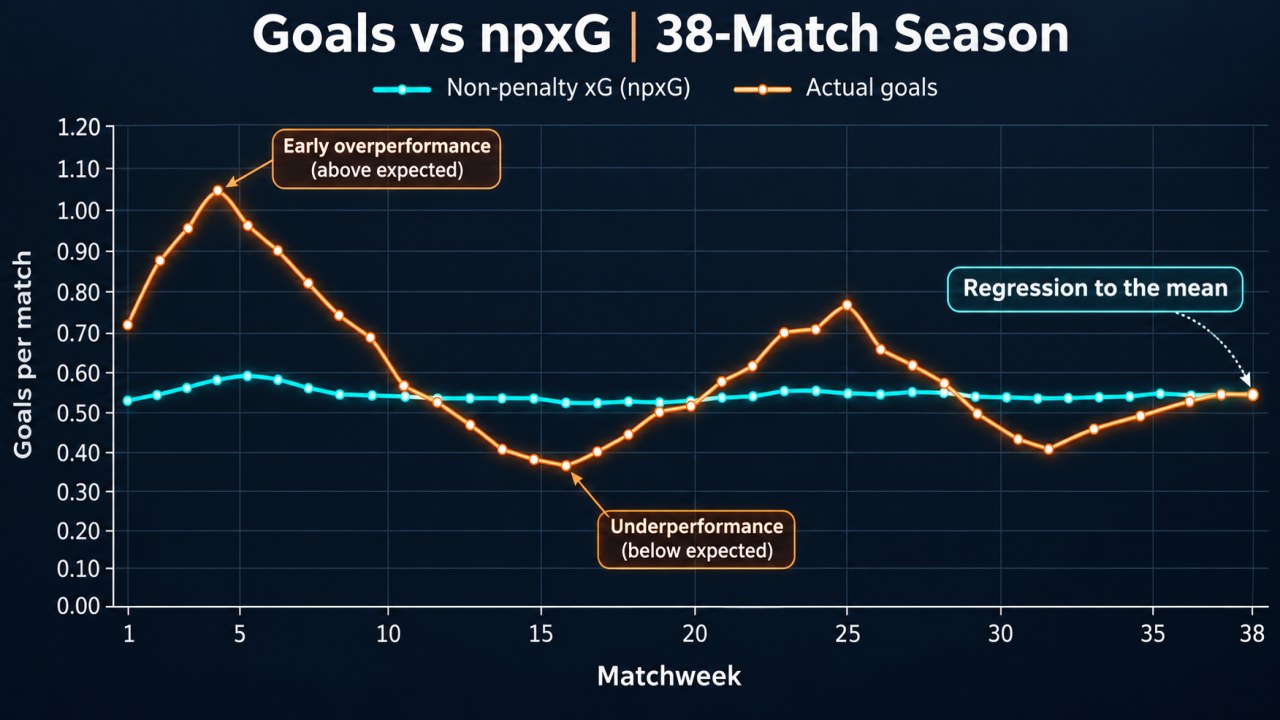
One of the most powerful diagnostic uses of xG is detecting statistical unsustainability. When a striker scores 14 goals from an xG of only 6.2, media headlines inevitably hail their "clinical finishing." However, extensive historical tracking demonstrates that with very few generational exceptions (such as prime Lionel Messi or Erling Haaland), almost all players regress to their expected baseline over a 38-game season.
When a team is dramatically overperforming its xG (scoring far more goals than chance quality warrants) while conceding far fewer goals than its Expected Goals Conceded (xGA) indicates, tactical analysts recognize that regression is imminent. Conversely, a team enduring a 5-match losing streak despite consistently out-generating opponents in xG is fundamentally sound and likely to experience a sharp rebound in results once finishing variance normalizes.
4. Integrating xG with Poisson Distributions
At SportyAI, Expected Goals does not exist in isolation. Rather than relying on simple historical goal counts, our modeling engine feeds rolling npxG and xGA ratings directly into the Poisson parameter generator. By utilizing expected goals as the foundational input for team attack and defense strength, our models capture true process performance rather than fluke outcome noise.
Explore our daily Poisson probability distributions, Expected Goals (xG) models, and comprehensive tactical fixture previews.